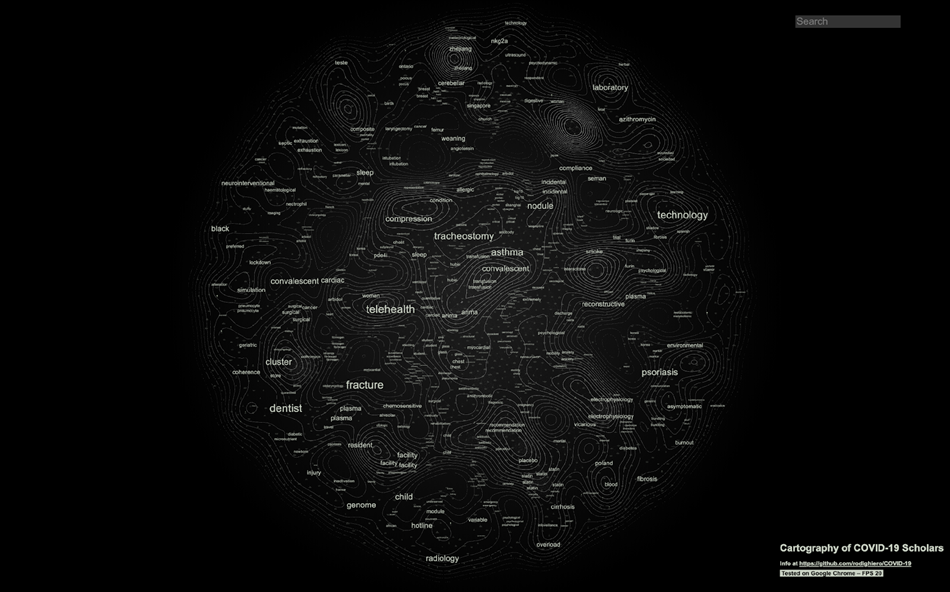
Cartography of COVID-19 Scientific Literature
Code on Github Watch Visualization
By Dario Rodighiero
MIT CWS, metalab (at) harvard, berkman klein center for internet and society, USA
Network visualizations are useful instrument to have a distant view from a subject. This visualization was created to see the scientific community behind the COVID-19. Who are they? When did they begin to being involved? With whom do they work? Which are their specializations?
Method
Using the open-source database COVID‑19 Open Research Dataset (CORD‑19) released on July 1, 2020 by the Allen Institute for AI, scientific articles are grouped by authors and analyzed with methods of Natural Language Processing. The result is a metric of lexical similarity between authors, which enabled to space out the scientific community as a network where two authors that use the same vocabulary are next to each other. (More information about the method on this article titled Mapping as a Contemporary Instrument for Orientation in Conferences).
Use
Check the cartography at this URL. After a few seconds needed to stabilize forces, a network composed by the major authors working on the COVID-19 subject is visible. The elevation map in yellow points out as peaks the most active areas of research. When two close authors have at least a common keyword, that is visible between them with a font size that reflects the edge’s weight. By moving over an author, the relative network of peers is highlighted as well as the keywords that define his/her profile. The left panel shows a few author’s information with the most relevant keywords, the nationality of his/her community, and the publication years. On the top right a search function to find a specific author.
Acknowledgments
The project started during the Digital Humanities Conference 2019 with the spirit to create the cartography of the DH community. At that moment, it was priceless the contribution of Daniele Guido (University of Luxembourg), Philippe Rivière (Visiocarto), and Stephan Risi (MIT).
This version has been improved thanks to Eveline Wandl-Vogt from Austrian Academy of Sciences and Elian Carsenat NamSor. The data about nationality / country of origin / ethnicity or diaspora are generated through the NamSor algorithm (NamSor API v2.0.9B02) ; NamSor is not 100% accurate, and accuracy is in range 85%-95% so name origin inference introduces potential bias and error; for privacy reason, the data is presented at an aggregate level; also privacy-related, individuals can suggest corrections to inferred origin in diaspora.csv file, or out-out if they wish; although this inferred data is not perfect, both nationality and university affiliation are missing from the original CORD-19 data set and visualizing this data can give further insights on the literary production.